Originally published on November 18, 2021 for Deceleration
www.deceleration.news
Energy burden—the proportion of one’s income used for home-energy bills—is a reality across San Antonio and the region. The concept of ‘energy burden,’ or paying more than six percent of one’s income on home energy, is getting increased attention for its role in maintaining generational poverty.
San Antonio’s City Council voted to dedicate $30 million of its American Rescue Plan Act funding to help residents avoid forced disconnections from power and water utilities. The action highlights the remarkable strain of the moment, with more than 65,000 homes now qualifying for disconnections for nonpayment. But even in pre-COVID times, City-owned CPS Energy was cutting power to tens of thousands to possibly hundreds of thousands of residents each year for their inability to keep up with the bills. The colliding crises COVID has centered has awakened concerns about energy-justice, however, and more people are expressing concern about the reality of “energy burden.”
The simple truth is: Energy costs more when you have less. On average, people considered low-income by national measures pay, on average, 8.6 percent of their total earnings on electricity and gas. Those writing the checks in “non-low-income households” pay an average of 3 percent. (For reference, low-income is defined as less than or equal to 200 percent of the federal poverty level, or $34,840 for a two-person household).
Local data reflects a similar spread: low-income homes here pay CPS Energy an average of 7.4 percent of their monthly income compared to 2.4 percent for non-low-income homes, according to a Deceleration analysis utilizing data provided by Greenlink Analytics.
If, in that, we fit the status quo, it’s not particularly comforting. The median amount residents pay for their electricity and gas in proportion to their income is 4.4 percent, or a little less than one out of every 20 dollars earned. Across Bexar County, large numbers of renters and homeowners are paying an even greater price for power relative to their income (see map above). By this metric, many neighborhoods across San Antonio qualify as “severely energy burdened,” paying one of every 10 dollars for energy. Residents of the five neighborhoods listed below are all paying between 10 percent and nearly 20 percent of their earnings, or one of every five dollars earned, to CPS Energy.
Breaking out low-income homes specifically shows that the most severe utility burden is concentrated, in general, among renters, elders, and people of color.
Public-health expert Tim Barr investigated energy burden last year while producing a full report on the demands of energy justice in San Antonio, publishing “Advancing Energy Justice in San Antonio Through Household Energy Policies” for the Climate Action SA coalition. It was subsequently shared by CASA members with local elected leaders, who have since been asking questions about the reality of energy burden in forums like the City’s Municipal Utilities Committee.
“By far, the most shocking thing is that within the San Antonio metro area, one out of every four low-income households have an energy burden equal to or greater than 21.7% of household income,” he wrote Deceleration. “That’s the second largest relative burden among 25 metro areas sampled by the US Census Bureau’s American Housing Survey, and it can largely be attributed to energy inefficiency.”
National-level research backs that up. And it points to one of the cruelest legacies of the outsized energy burden borne by low-income residents.
“Households with high energy burdens are more likely to stay caught in cycles of poverty,” wrote the authors of a national energy burden study from the American Council for an Energy-Efficient Economy.
“After controlling for common predictors of poverty status such as income loss, illness, health, marital status, education, health insurance, and head of households—Bohr and McCreery (2019) found that, on average, energy-burdened households have a 175–200% chance of remaining in poverty for a longer period of time compared to non energy-burdened households.”
Deceleration wanted to understand which neighborhoods had the highest number of homes experiencing severe energy burden. So we limited our analysis to homes qualifying as severely energy burdened (meaning: more than one of every 10 dollars earned is dedicated to paying the power bill). Though the West, South, and East sides of San Antonio dominate, we found there are extremely energy burdened homes across all of Bexar County. Some of the communities experiencing the highest percentage of energy burden don’t show up on this list because the numbers of homes are significantly less overall, but they deserve mention.
Census Tract 1105, that is the community along Avenida Guadalupe stretching from I-35 to the Alazan-Apache Courts has the City’s highest energy-burden rate of 19.42 percent. The second-highest percentage of income going to cover home-energy costs is in a portion of the Knob Hill community on San Antonio’s East Side, where residents pay 18.65% of their income to CPS Energy.
Below is a map ranking the greatest number of severely energy-burdened homes according to Deceleration’s review of Greenlink Analytics Equity Map toolkit.
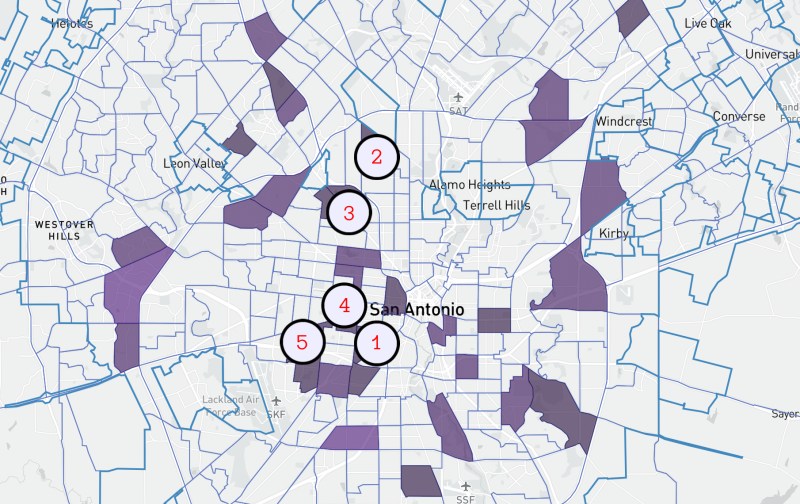
Neighborhoods with the highest density of extreme energy burden are spread around the City and County, though the top 5 are clustered on San Antonio’s West, Southwest, and Northwest sides. These neighborhoods have the most homes paying more than one of every 10 dollars earned to CPS Energy.
1. Brady Gardens
Census Tract 1601, Bexar County, Texas. Between the produce terminal inside Zarzamora and the stockyards on the city’s near-west side and to the north of Frio City Road are 1,954 homes, of which 1,371 are considered severely energy burdened. Homes date to the 1920s, according to a review of Bexar County Appraisal District data. The median family income is listed as $28,455.
2. Dellview
Census Tract 1910.03, Bexar County, Texas. A stone’s throw from the Oblate School of Theology and bounded by Loop 410 on the city’s North Side are a row of apartments—Lincoln Village, Elan Gardens, The Enclave at 1550—sheltering thousands of one- and two-bedroom homes. Of the 2,958 homes in Census Tract 1910.03, Greenlink lists 1,223 as experiencing severe energy burden. The median income is listed as $31,804.
3. Maverick
Census Tract 1802.02, Bexar County, Texas. Of Bexar County’s roughly 100,653 homes rated as having severe energy burden, 1,165 are in Census Tract 1802.02. Behind a clutch of apartments, including Fredericksburg Place, Apartments Northwest, and the Sorento, are several tree-lined neighborhoods with a median income of $23,255.
4. Elmendorf/Las Palmas
Census Tract 1703, Bexar County, Texas. Edging up to Elmendorf Lake Park and Our Lady of the Lake University are a collection of neighborhoods in the heart of the Westside where Guadalupe tilts into Castroville Road. Third-highest among all Bexar County Census tracts, residents here pay 14.42 of their income for electricity and gas. Just over 1100 homes of the 1683 listed are in extreme energy burden. The listed median income is $25,139.
5. Greater Gardendale
Census Tract 1606, Bexar County, Texas. Further along Castroville Road to the West but before reaching the toxic plume under Kelly Field are 1432 homes of which 900 are considered in extreme energy burden. The median income is $25,500. Residents here pay 14.21 percent of their income to CPS Energy, fifth highest among Bexar County Census tracts.
As a whole, Barr’s recommendations are worth reviewing. They include a call to limit energy burden by capping the rates charged to low-income residents as well as for more robust weatherization programs—programs that have recently come under attack within the CPS Energy Board of Trustees.
“If CPS Energy were more proactive and aggressive in weatherizing the homes of low-income households,” Barr wrote Deceleration, “it would not only dramatically reduce household energy burdens and improve air quality, but also help prevent blackouts like we experienced during the 2021 winter storm.”
( Image: Greenlink Analytics search by Deceleration: The lightest purple represents homes paying more than the national average of 3%; purple shows homes above the 6% threshold for “high energy burden”; and the darkest census tracts show homes above the 10% threshold for “severe energy burden.” )


